Climate change and global warming
Table of Contents
NOTE: This is a fairly patchy file so far. I’ll be fiddling with it for a while.
Global warming became a topic of mainstream conversation as I was coming of age in the late 1980s. As a budding environmentalist in the early to mid-1990s, I dropped in at climate negotiations in Geneva in 1993 (to no useful effect at all), and helped launch a climate campaign in Norway in 1995 before moving abroad. Since then, I’ve been a distant but concerned observer.
The resurgence of climate-change denial around 2007-ish led me to do a bit of research. I quickly learned that the arguments of the organized climate-denier movement lacked merit, but realized I’d have a lot more to learn if I wanted to understand the science well enough to stand up for it in debate. For the following decade, I inexpertly but obsessively tried to keep up with some of the latest peer-reviewed science every week, and occasionally blogged about it in Norwegian at MotNormalt.
The present notes mainly set out some key concepts and terms that are useful to know when one wants to understand more of the debate, and point to some useful sources. There’s some math and diagrams here and there, for those interested.
Viewpoint/synopsis
Natural climate changes have always taken place, but today, humans are forcing the climate to change beyond recognition: beyond the comfortable envelope to which we are accustomed as a civilization, and even as a species. We have upset the natural balance of the carbon cycle with CO2 from fossil fuels, thus enhancing the greenhouse effect and changing the energy balance of our planet with space. (What could possibly go wrong, right?)
The world has many other problems; climate change makes them worse: the destruction of ecosystems and extinction of species, the race to feed a growing population, and the plight of the poor in the South. For thousands of years, our decisions on where to grow our crops and build our cities have relied on the climate and the sea level remaining fairly stable. These bets are now off. Every year, floods, droughts and heatwaves remind us how vulnerable we are.
Our emissions to date have already locked in climate change for decades and centuries to come, and we’ll need to adapt. In order to have a chance to adapt, however, we must prevent (“mitigate”) further climate change by stopping emissions.
Because CO2 accumulates in the atmosphere, preventing further climate change means getting to zero emissions. We have a very tight schedule to get there if we are to avoid the internationally agreed guardrail of 2°C warming, which leaves us with a very slim carbon budget of fossil fuels we’re still allowed to burn.
Climate science is a fascinating field, and much science worth doing remains to be done. But while science is never settled, there are no longer any serious “ifs” about man-made climate change, and even the “how much” questions do not greatly affect the bottom line on mitigation actions that need to be taken today. Those who pretend otherwise are simply using science as a proxy in a political fight.
Rather, anthropogenic climate change has become primarily a political and ethical problem. How can we overcome the inertia engendered by collective action problems and industry lobbies? How can we “decarbonize” a fossil-fueled world economy in time? What would it mean to do so justly and equitably, in a world where the historical use of fossil fuels has disproportionately benefited the rich world, while the impacts of climate change will disproportionately harm the poor? How do we value the lives of future generations, and what would make us act in their interest, not only in our own? How do we value non-human species?
Done right, fighting climate change could bring about a better, more equitable world, powered by clean energy forever, rather than by a short-lived windfall of fossil fuels. Done wrong, e.g. with risky geoengineering fixes, it could do massive harm. We really need to think, talk, and act rationally about this as a society. Unfortunately, it’s a different kind of problem for humans to think about, and political propaganda makes it harder.
Sources and credibility
The web is full of actively misleading disinformation about climate change, from outright denial of the science to subtler means of sowing doubt and confusion. The book Merchants of Doubt (Oreskes and Conway 2010) shows, for the U.S., how this is just the latest in a series of disinformation campaigns waged over everything from smoking via acid rain to the ozone hole, often by the same handful of free-market think-tanks and contrarian scientists.
Doubt is our product since it is the best means of competing with the “body of fact” that exists in the mind of the general public. It is also the means of establishing a controversy.
— Tobacco industry memo, 1969
Whom to trust? Some people have come up with helpful rules of thumb, like Kaitlin Alexander’s Credibility Spectrum and Bart Verheggen’s Who To Believe.
Blogs, obviously, are not trusted scientific publications, and denialist peanut galleries like WattsUpWithThat rightly belong at the bottom of the trust scale. Still, you might do well to follow blogs by actively publishing climate scientists, like RealClimate. At their best, blogs may answer questions you have that don’t come up in more reputable sources, give you much-needed perspective on new findings, and provide quick rebuttals to nonsense spreading on the net. A website that specializes in rebutting myths is SkepticalScience.
Some other notable blogs by practising climate scientists are Climate Lab Book, Variable Variability, Kate Has Things To Say.
A useful question to ask of any claim is whether it has been published in a peer-reviewed scientific journal, and so has held up to a bit of scrutiny. But remember, no single study is going to overturn the scientific consensus.
Your most reliable source is major reviews and assessments of the published science, like that of the IPCC, which take all the peer-reviewed evidence into account and add yet another layer of scrutiny. As well as thousands of pages written by committee, unfortunately.
Luckily, the UK Royal Society and the U.S. National Academy of Sciences have teamed up to produce a clear, readable and blessedly concise guide to the physical science, the 36-page Climate Change: Evidence and Causes.
The Intergovernmental Panel on Climate Change (IPCC) produces the major, international assessment of the science on climate change every six years or so in a painstaking open review process. You can find all the IPCC’s reports online: the latest, published in 2021–2022, is called the Sixth Assessment Report (AR6). The main report is divided into four volumes by three Working Groups, on the physical science, impacts and adaptation, and mitigation respectively. You’d want to start with the Synthesis Report (forthcoming), which sums up the whole thing, or the Summaries for Policy-Makers, FAQs, fact sheets and Technical Summaries of each working group.
If you’re interested in this, sooner or later you’ll need to crack a textbook. Yes, even if you are a physicist. If you’re not, Global Warming: Understanding the Forecast (Archer 2011) will ease you gently into the minimum physics you need to know. For further reading, I like the Princeton Primers in Climate, handy little paperbacks with accessible introductions to various aspects of the problem. A great historical introduction to the field is Spencer Weart’s The Discovery of Global Warming, available in print (Weart 2008), but best read online, for free.
The physical science
The (pumped-up) carbon cycle
A crucially important greenhouse gas is carbon dioxide, CO2. The carbon (C) atom in CO2 can be part of many other compounds as it cycles through the world’s air, soil and oceans. Therefore, it is sometimes appropriate to talk about “carbon” and sometimes about “CO2”, and one must pay attention to whether figures are given in tons of CO2 or tons of C (1 ton C = 3.67 tons CO2).
CO2 is part of the global carbon cycle. It is swiftly exchanged between three reservoirs: the oceans, the atmosphere, and the terrestrial biosphere, i.e. soils and vegetation on land. It is also part of a much slower geological exchange between these three, on the one hand, and the Earth’s rocky crust, on the other, through weathering, subduction of sediments, and volcanic emissions. The IPCC gives a handy overview of these estimated stocks and flows (Fig. 1).
Handy, yes, but what an eyesore. Oh for the pretty drawing of AR5 fig. 6-1.
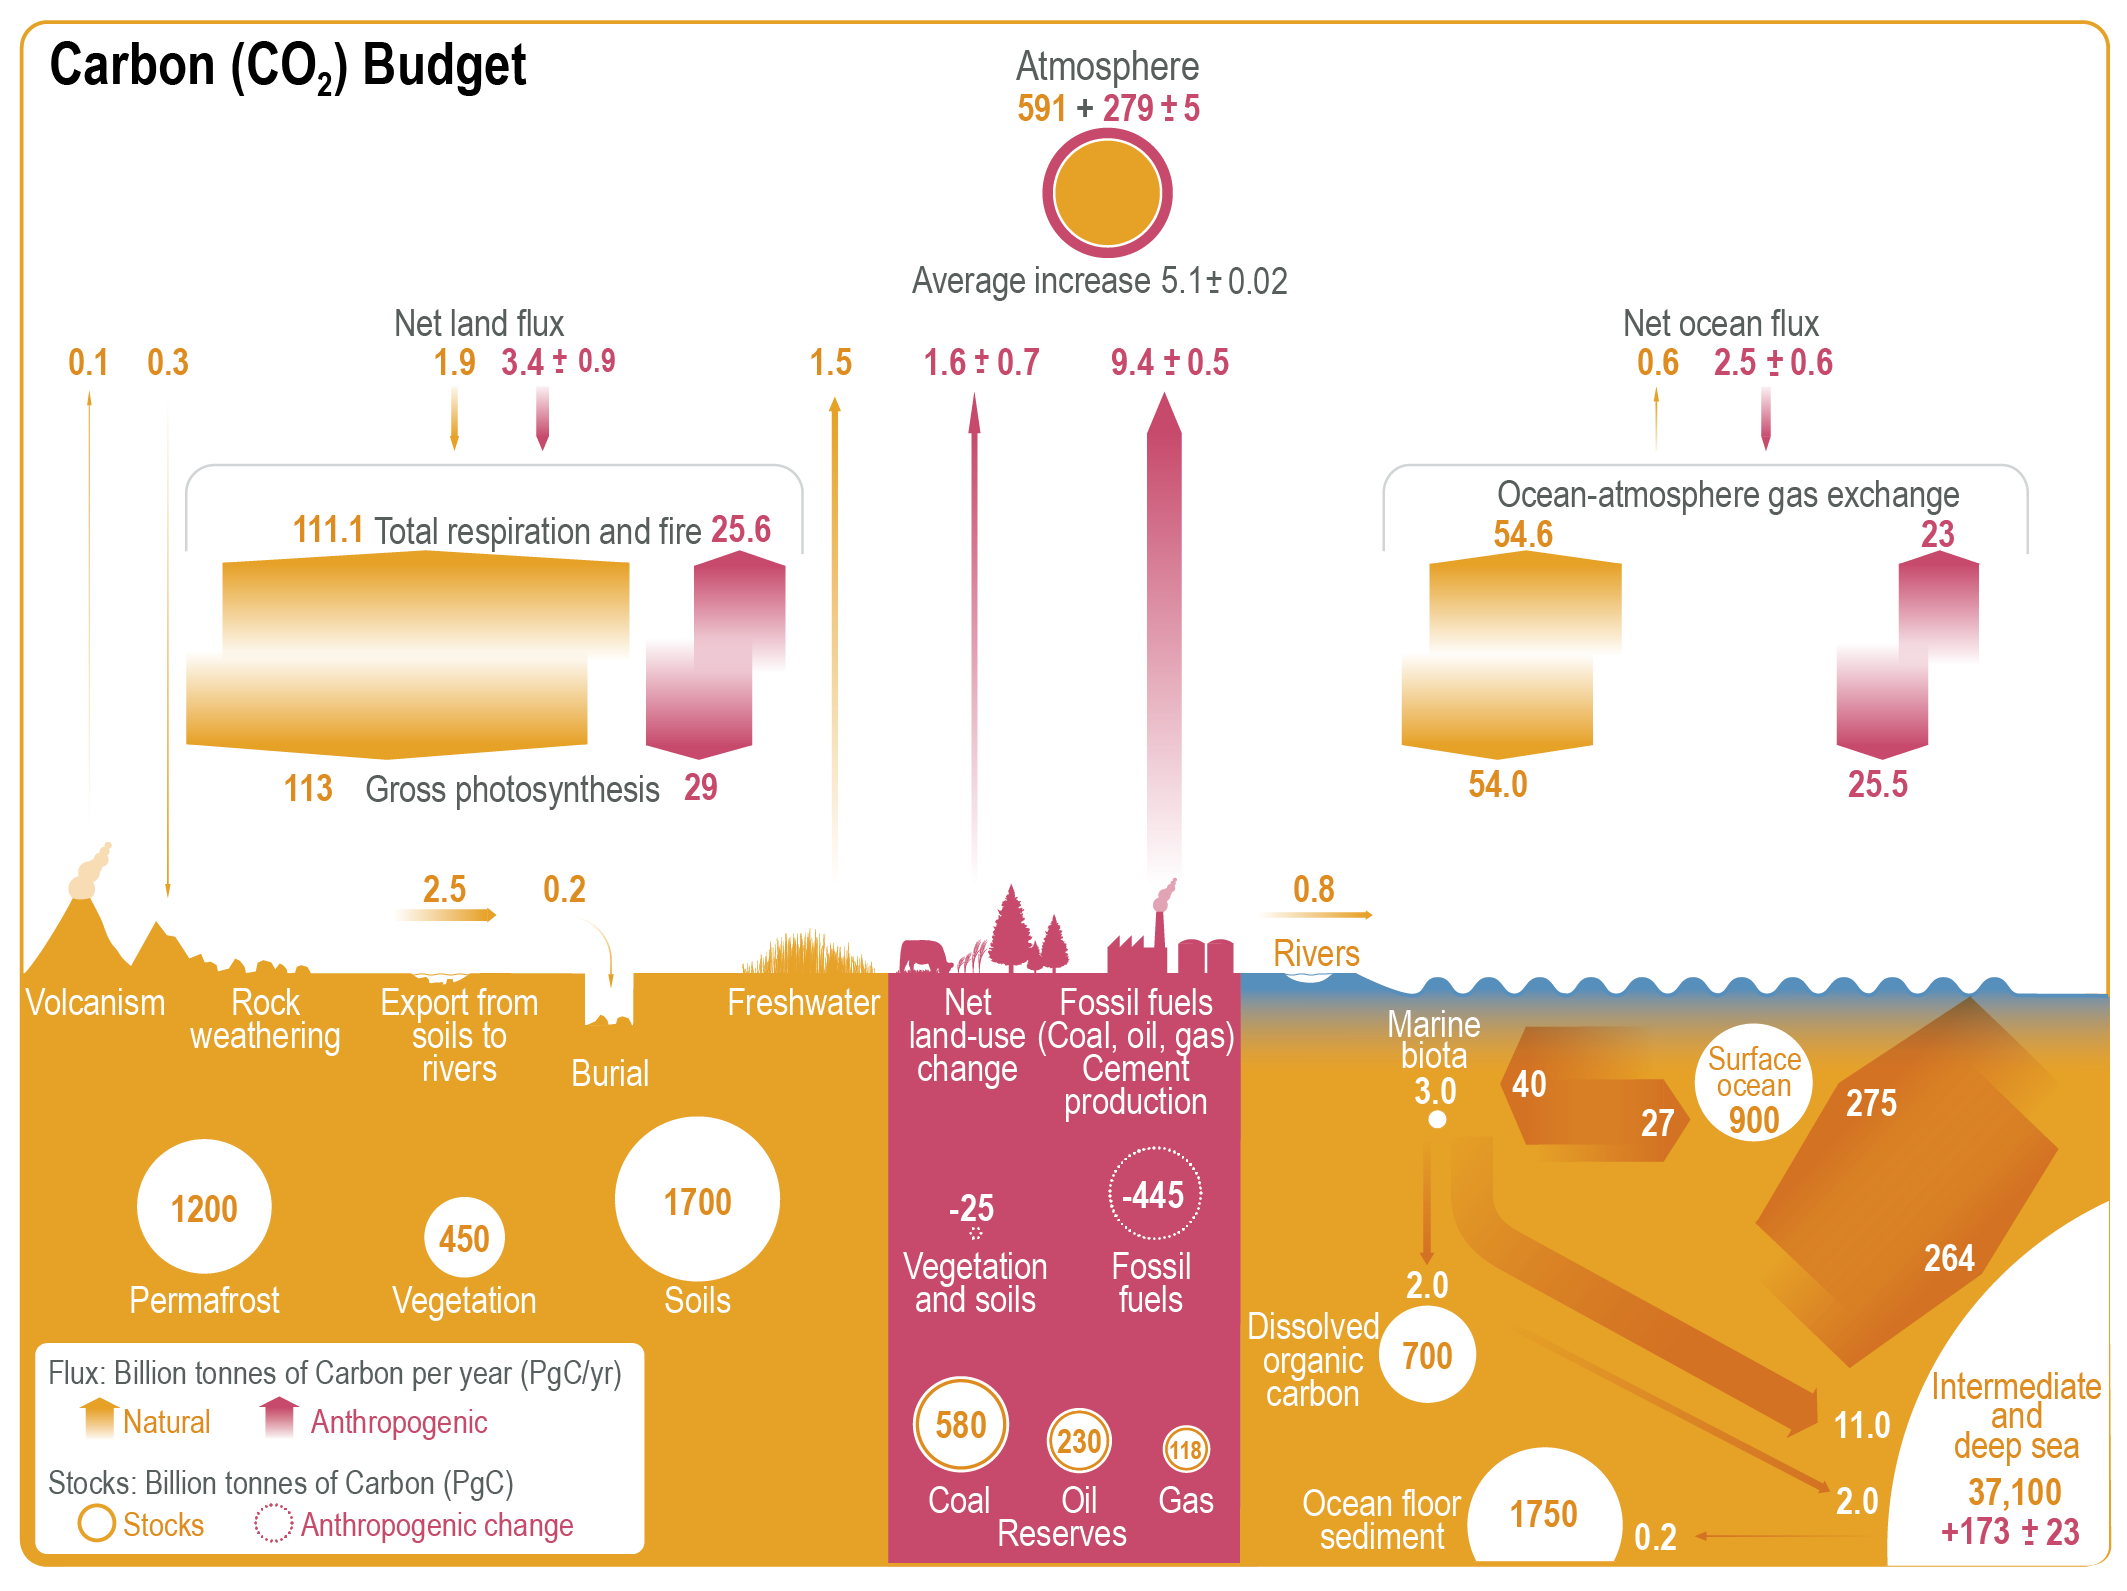
Figure 1: Source: IPCC AR6 WG1 ch. 5 (Canadell et al. 2021), fig. 5.12.
Humans have boosted “geological” emissions immensely by digging up and burning fossil fuels. Over a few industrial-age centuries, we are injecting back into the atmosphere CO2 that was removed from it over hundreds of millions of years. As a result, the atmosphere and the oceans are taking up an increasing amount of CO2. The terrestrial biosphere is also currently a net sink for CO2, despite substantial emissions from deforestation etc.
There has been some confusion over the atmospheric lifetime of CO2, which even the IPCC at one time misleadingly quoted as 5–200 years. It is now understood that CO2 does not have a simple atmospheric lifetime or half-life, because it is removed from the atmosphere by different processes acting over widely different timescales. From year to year, about half our emissions are taken up by oceans and land, with the other half left to accumulate in the atmosphere; this airborne fraction may change in the future. If we stop burning fossil fuels, over the next ~1,000 years or so the overturning ocean will continue to draw down atmospheric CO2. Over the next ~10,000 years, dissolving carbonates will replenish the ocean’s ability to take up yet more CO2. And over the next ~100,000 years, increased rock weathering in a warmer, wetter world will slowly smooth out the man-made CO2 bump altogether (Archer et al. 2009).
When people talk about an atmospheric lifetime of 5 years, they refer to the irrelevant average time an individual CO2 molecule might spend in the atmosphere before being exchanged with CO2 from the land or sea. In other words, the flows into and out of the atmosphere replace about 20% of atmospheric CO2 a year. But an exchange of molecules does not affect the atmospheric concentration of CO2, and climate change is all about concentrations, not about individual molecules.
The (enhanced) greenhouse effect
Greenhouse gases (GHGs) in the atmosphere keep the Earth warmer than it would otherwise be, through the “greenhouse effect”. The atmosphere is like a greenhouse in the sense that it lets sunlight in, but slows the rate of heat loss to the surroundings. The analogy is not perfect. A greenhouse works mainly by preventing convective heat loss (warm air rising out of the greenhouse). The Earth as a whole, however, is already convectively isolated by the vacuum of space; the only way it can lose heat is by electromagnetic radiation.
The greenhouse gases work by “isolating” the Earth radiatively in part of the long-wave spectrum where Earth radiates, so Earth loses heat to space from higher, colder layers of the atmosphere, rather than directly from the surface. Like the glass walls of a greenhouse, the GHGs are mostly transparent to the shortwave spectrum where the hotter Sun radiates. Man-made increases in the concentration of GHGs enhance the natural greenhouse effect, improving the “isolation” and allowing the surface to warm.
Contrary to some wilful misunderstandings, the greenhouse effect is not assumed to “create” any energy. The only energy source in this picture is the Sun. Total solar irradiation (TSI) averaged over the Earth’s orbit is about 1361 W/m2 through the plane perpendicular to the sun’s rays. Absorbed solar radiation (ASR) is the TSI, minus the ~30% of the light reflected back to space (albedo), divided by a factor of four to average the intercepted sunlight over the whole spherical surface of the Earth. It works out to ~240 W/m2, absorbed partly in the atmosphere but mostly at the surface.
The 1/4 factor is the ratio of the area that intercepts the sun’s rays, the plane cross-section of the Earth, \(\pi r^2\), to the surface area of the sphere, \(4 \pi r^2\).
The natural greenhouse effect is about 33 °C, which refers to the difference between the actual global mean surface temperature (about 15 °C or 288 K) and what it would have been if the Earth’s surface radiated directly to space (-18 °C or 255 K). How do we know what it would have been? At equilibrium, when it is neither warming up or cooling down, the Earth must radiate an equally intense flux of energy to space as it absorbs from the sun. The thermal radiation of an object increases in intensity with the fourth power of its absolute temperature, according to Stefan-Boltzmann’s law, \(F = \sigma T^4\) for a blackbody, where σ is the constant 5.67⋅10-8 W m-2 K-1. (As one can plainly see, the Earth’s surface is not “black” in the visible spectrum, but it does act nearly like a blackbody in the infrared spectrum.) At equilibrium, then, if the Earth’s surface radiated 240 W/m2 directly to space, it would have a temperature of
\[ T = \sqrt[4]{\frac{F}{\sigma}} = 255 \mathrm{K} \]
The full Stefan-Boltzmann law includes a term ε for emissivity, \(F = \epsilon \sigma T^4\), where \(0 < \epsilon < 1\) and a blackbody has \(\epsilon = 1\). The Stefan-Boltzmann constant σ is approx. 5.67⋅10-8 W m-2 K-1. K refers to degrees Kelvin, a measure of absolute temperature. The Kelvin scale has 100 degrees difference between the freezing and boiling points of water, just like the Celsius scale, but it starts at absolute zero, 0 K = -273.15°C, so 255 K = -18°C.
There are two main simplified explanations of the (natural and enhanced) greenhouse effect, one looking down from the top of the atmosphere, and one looking up from the surface. Both are incomplete without the other, but we’ll start with the one that provides a better overall understanding.
Raising the effective radiating level. By both absorbing and emitting infrared heat radiation, greenhouse gases prevent the surface from radiating directly to space, and enable the atmosphere higher up to do so instead. Increasing the GHG concentration makes the atmosphere even less transparent to long-wave radiation on certain wavelengths, which can consequently only escape to space from increasingly high up in the atmosphere. One way to look at it is to see increasing GHGs as raising the effective radiating level, a theoretical average height above the surface from which the atmosphere radiates to space, presently some five kilometers up.
Crucially, in the lower part of the Earth’s atmosphere (the troposphere) the temperature lapses with height. The lapse rate, the rate of temperature change with height in the Earth’s atmosphere, is pretty linear and averages about -6.5°C/km (more where it’s dry, less where it’s humid). The higher the radiating level, then, the colder the air, and hence by Stefan-Boltzmann’s law, the less radiation is emitted, slowing the rate of radiative heat loss from Earth to space.
Imagine a sudden increase in GHGs: this would raise the emission level and reduce the long-wave heat radiation leaving Earth, without reducing incoming sunshine. The energy imbalance would heat the Earth, increasing temperatures from the surface all the way up through the atmospheric column, until the air at the new emission level is once again warm enough (255 K) to radiate in equilibrium with absorbed sunlight.
This line of reasoning allows us to express the greenhouse effect (GHE) as simply the product of the effective radiating level \(z_{\mathrm{eff}}\) and the lapse rate \(\partial T / \partial z\):
\[ \mathrm{GHE} = z_{\mathrm{eff}} \frac{\partial T}{\partial z} = 5 \, \mathrm{km} \times \frac{6.5 \, \mathrm{K}}{\mathrm{km}} \approx 33 \, \mathrm{K} \]
The \(\partial\) sign denotes a partial derivative. If you don’t know what a derivative is, just think of it as standing for “difference” or “change”.
Unfortunately, there isn’t really any simple expression for determining the effective radiating level from GHG concentrations, so the expression is more of an elegant way to think about the GHE than a practical means of calculating it.
Increasing atmospheric downward radiation. GHG molecules both absorb and emit longwave radiation (heat radiation). An emitted photon can go in any direction, so it will go up toward space about half the time and down toward the surface the other half. This downwelling long-wave radiation (DLR) from the atmosphere to the surface is often misleadingly called “back radiation”, but the DLR is not surface radiation “sent back”, it’s simply atmospheric radiation, and depends only on the temperature and emissivity of the relevant layers of the atmosphere.
Even as radiative equilibrium is maintained at the top of the atmosphere, increasing GHG concentrations increase the amount of radiation up and down between layers of the atmosphere and between the atmosphere and the surface. The surface is heated by the increased DLR until it reaches a new equilibrium temperature where it again sheds as much heat as it gets.
Some people refuse to accept that a colder atmosphere can radiate to a warmer surface, or that the surface actually receives a more intense flux from the atmosphere than from the sun; they claim that this violates thermodynamics, as heat can only go from a warmer place to a colder one. This is a confusion. Thermodynamics deals with heat, which is the net transfer of energy. An energy flux from the atmosphere to the surface does not violate thermodynamics; there is in fact an opposite, and larger radiative flux from the surface to the atmosphere, as well as sensible and latent heat transfer by convection. The net flux does go from the scorching sun to the cozy surface to the colder atmosphere, as it should.
Textbooks typically start explaining this with highly simplified models where the atmosphere starts out behaving like a single pane of glass at radiative-equilibrium temperature, but this explanation must be quickly unlearned, since temperatures in the real atmosphere are dominated by convection, not radiation. The American Chemical Society has a good explanation with a single-layer and a multi-layer model.
Forcings, feedbacks, sensitivity
A forcing is something outside the climate system that causes the climate to change. Being outside means that it affects climate, but is not itself greatly affected by climate in turn; in this it may be distinguished both from feedbacks and internal variability in the system. By forcings we often mean radiative forcings, i.e. those that affect the balance between energy going into or out of the Earth system as electromagnetic radiation, and which are required to warm up or cool down the planet as a whole over any lengthy stretch of time. As a metaphor, a forcing on the level of water in a bathtub would be turning up (or down) the flow of water from the faucet, or plugging or unplugging the drain.
Forcings may be natural or man-made. Natural radiative forcings include: the sun growing brighter or dimmer, slow changes in the Earth’s orbit, or huge volcano eruptions throwing reflective sulphates into the stratosphere. Man-made radiative forcings include: the emission of CO2 from fossil fuels; the emission of sulphates from fossil fuels; land-use changes such as the clearing of forests, which among other things changes the reflectivity of the earth’s surface.
Radiative forcings are measured in the common currency of watts per square meter of the Earth’s surface, written W/m2 or, equivalently, W m-2, which is easy to envisage in terms of old-style light bulbs on a square meter of ceiling. A doubling of CO2 produces a forcing of about 4 W/m2. To a first approximation, different forcings are equivalent; 4 W/m2 more absorbed sunlight may be expected to give the same warming as a doubling of CO2. However, because sunlight hits some parts of the world more than others, it may cause different feedbacks, and thus more or less warming. We say it has a different efficacy.
Internal variability inside the climate system, to continue the bathtub metaphor, is like the sloshing around of the water inside the tub, which may greatly affect the water level in part of the tub for a moment, but doesn’t create a lasting change in the level. The most important mode of internal variability in the Earth’s climate from year to year is ENSO, the shifting between “El Niño” and “La Niña” conditions as a pool of warm water, interacting with winds, sloshes about in the Pacific ocean.
Whether something is a forcing, a feedback, or internal variability may depend on the timescale or the reference system in question. E.g.:
- Internal variability in one region that affects the local climate in another may be described as a forcing if the system of reference is the climate in the latter region.
- The modern CO2 increase is a man-made forcing, but over the course of the ice ages, CO2 increased and decreased as a feedback on natural temperature changes.
- The increased heat radiation shed by a warmer Earth surface is sometimes called a feedback (the Planck feedback), but others prefer to define it as part of the reference system and not as a feedback.
Feedbacks are mechanisms that amplify or dampen the climate response to a forcing. Sticking with the bathtub metaphor, if the rate of flow down the drain increases as the pressure of water above increases, that would be a “negative” feedback slowing down the rise of water in the tub. When discussing climate change, feedbacks are typically changes in radiation (like radiative forcings) that happen as a response to forced changes in surface temperature.
An important example is the water-vapor feedback: when the surface and atmosphere above it warms, the air can hold more water vapor, which in turn enhances the greenhouse effect because water vapor is a greenhouse gas. Water vapor provides a so-called “positive” feedback, amplifying warming (which is really a negative outcome from our point of view, so the terminology can be confusing). At the same time, water vapor transports heat upwards, smoothing out the temperature difference between the surface and the air aloft; this lapse-rate feedback counteracts the greenhouse effect, and so dampens the warming (a “negative” feedback). But this latter effect is weaker, so in sum, water vapor amplifies warming.
Climate sensitivity is the warming we expect from a given forcing. It is conventionally defined as the global mean surface warming caused by a doubling of CO2 (the forcing from CO2 is logarithmic with the concentration, so every doubling of the concentration results in the same additional forcing). The Earth takes time to respond to a forcing, which gives rise to different kinds of sensitivity defined for different timescales.
- Most often, “climate sensitivity” is used to refer to the equilibrium climate sensitivity (ECS): how warm it will get decades to centuries after a CO2 doubling when the Earth reaches radiative equilibrium, i.e. after the oceans have warmed and “fast feedbacks” like water vapor, clouds and sea-ice have had time to act, but before major changes to the ice sheets or carbon cycle.
- More useful for short-term policy is the transient climate response (TCR), how warm it will get at immediately at the time of CO2 doubling. The TCR is less than ECS because the Earth will continue to warm towards equilibrium.
- The ECS, in turn, is less than the Earth system sensitivity (ESS), how warm it will get centuries to millennia after a CO2 doubling when the “slow” feedbacks come into play and the frost giants wake up.
Climate sensitivity is estimated from various lines of evidence: climate models run to equilibrium, or real-world evidence, whether from paleoclimate data or the modern instrumental period, combined with simple or complex models. In 1979, the ECS was estimated at around 3 °C, with a range of 1.5–4.5 °C (Charney et al. 1979), an estimate that did not change or narrow much for four decades, even as evidence grew to support it. By combining different lines of evidence, however, scientists are now able to report a likely range of 2.5–4 °C and a very likely range of 2–5 °C (IPCC AR6 WG1 section 7.5.5: Forster et al. 2021; cf. Sherwood et al. 2020). The IPCC estimates TCR at a likely 1.4–2.2 °C and very likely 1.2–2.4 °C (AR6 WG1 7.5.5). Again, these values are for a CO2 doubling; how much warming we will get depends both on the sensitivity and on how much CO2 we emit (and on other man-made influences).
Note that the forcing from a CO2 doubling in and of itself, without any feedbacks, would only be a little over 1 °C (sometimes called the Planck sensitivity). The bulk of the ~3 °C climate sensitivity, and nearly all of the uncertainty in the range, comes from feedbacks.